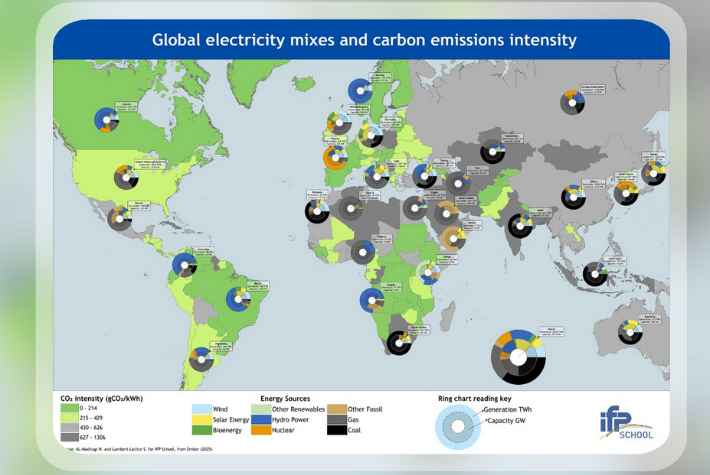
Heba Almadhagi, a student in IFP School's Energy Technology Economics and Management (ETEM) program, and Sidney Lambert-Lalitte, ETEM Program Supervisor, have produced a unique map illustrating the diversity of electricity production methods around the world.
It shows, for example, hydroelectricity in Norway and Canada, nuclear power in France, coal in India, and the rapid development of solar and wind power in Australia and Morocco.
The map distinguishes between installed capacity and actual production, highlighting significant variations in carbon intensity from less than 50 g CO2/kWh to more than 700 g CO2/kWh. It thus provides a clear overview of the challenges of global decarbonization.
The result of an analysis combining geography, history, and politics, this representation provides a better understanding of the dynamics and challenges of energy transitions.