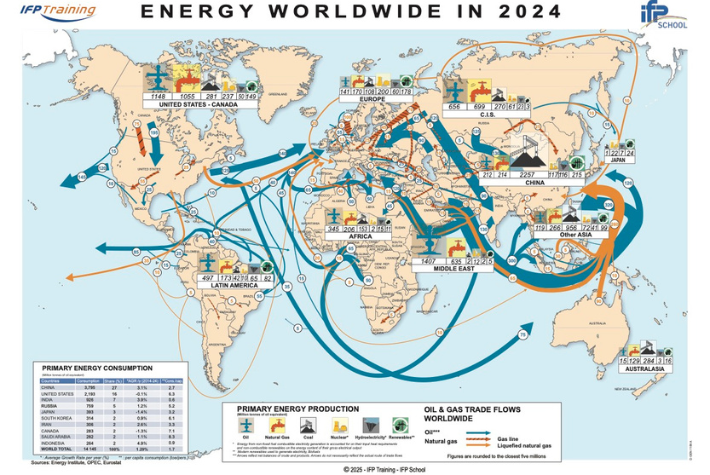
For nearly three decades, IFP School and IFP Training have joined forces to produce the energy flow map, a true snapshot of the evolution of continental energy mixes and interregional energy exchanges. This new edition, based on 2024 data from internationally recognized organizations (Energy Institute, OPEC, Eurostat), highlights the profound transformations that the energy sector has undergone in just a few years.
The map illustrates the rise in oil and natural gas exports from North America, especially towards Europe.
Asia—primarily China and India—has absorbed these Russian resources to meet their ever-growing energy demand, while at times re-exporting these resources to other continents.
Attentive readers will notice a decrease in the share of primary energy consumption from renewables in the global energy mixes. This is due to a methodological change in the way electricity generated from renewables is converted into primary energy equivalents. Nonetheless, renewables—particularly solar photovoltaics and wind power—continue to grow at a steady pace worldwide.
Many thanks to Sidney Lambert-Lalitte, Supervisor of the Specialized Engineering program in Energy Technology Economics and Management, for this insightful analysis!